Introduction
Today’s textile industry faces a problem as it produces too much clothing in relation to the demand. The high level of competition in the industry require the companies to apply different campaigns and sales to successfully sell off the products. Despite this, several companies report that they have failed to sell off their discounted products which has resulted in reduced margins. This study examines in-store signage and its impact on consumers’ attention when shopping reduced price products. The two aspects the study will proceed from are the effect of the colour and the message on consumers’ attention. Previous studies demonstrate that signage is an effective approach of attracting customers to stores. When it comes to the framing of signs, companies should consider customer segment since customers tend to respond differently depending on how a message is framed.
The study is based on a controlled experiment with a technical tool, eye tracking. The experiment was conducted in a clothing store for the purpose of pursuing a real-world environment and experience. A complementary questionnaire was used to collect information that the eye tracking glasses were unable to generate. The results of the study states that customers pay attention to signage when shopping discounted products. Regarding the choice of message framing, it appears that percentage promotions are most attractive due to the attention payed to these signs. The study also shows that the grey sign captured consumer attention to a greater extent than the red one.
Method
Finding a test store and respondants
The first step in the survey was to get in touch with the store manager at KappAhl, who was positive about the survey and left the students in place for several days as she felt that the survey would not be disruptive to their business. She also gave permission to change the existing signage to some extent in order to be able to test the hypotheses that were designed. Before the survey, people were asked in advance to book a time to come and carry out the experiment. This is because the sample would consist of at least 30 people and through the predetermined times, a smaller number of people needed to be recruited outside the store.
The planning of the survey times was done with the help of Doodle to get a simple and good overview of when the participants chose to come. The link to the Doodle planning was sent out to friends and acquaintances who were considered to fit in with KappAhl’s target group as it was sought to the test subjects would be similar to the target group, which would lead to a more realistic result. The majority of the test persons who participated in the survey had booked in advance at a time and only two people were recruited outside the store.
Eye tracking test and questionnaire
The in-store study began with one of the existing sale signs being replaced and then the signs that were to be included in the survey were photographed. These images were then used in the Tobii Pro Lab program in the analysis of the eye tracking data. Before the test subjects carried out the experiment, they were told how the equipment worked and that the glasses do not affect the eyes more than watching TV. Then the test person had to put on the eye tracking glasses and put the portable device in his pocket. The glasses were calibrated by the test person looking at a point on a calibration card and then the test person was instructed on the task which was to look for sales, promotions and offers in the store. To minimize the impact on the experiment, the instructions were short and concise and questions regarding how the test person would act when looking for the sale were not answered. This is because the experiment should be experienced and carried out as naturally as possible. The instructions the test subjects were given were: “Go into the store and look for sale, promotions and extra price” and then they were given a direction to start walking in. After about 1.5 to 2 minutes, the experiment was stopped and the test person was asked to fill in a short questionnaire about the shopping trip. The questionnaire included questions about previous experiences from the store, how the shopping trip with the eye tracking glasses was experienced and about the signage in the store.
Analysing the test data
In order to be able to read a result and draw any connections between the data collected through the eye tracking survey and the questionnaires, a review of the material was required. The data collected from the eye tracking equipment was transferred from the SD card in the portable device to the analysis program Tobii Pro Lab. Each test person’s shopping trip resulted in a film clip and the films were viewed individually to then be able to map the film sequences with the pictures of the signs taken in the store.
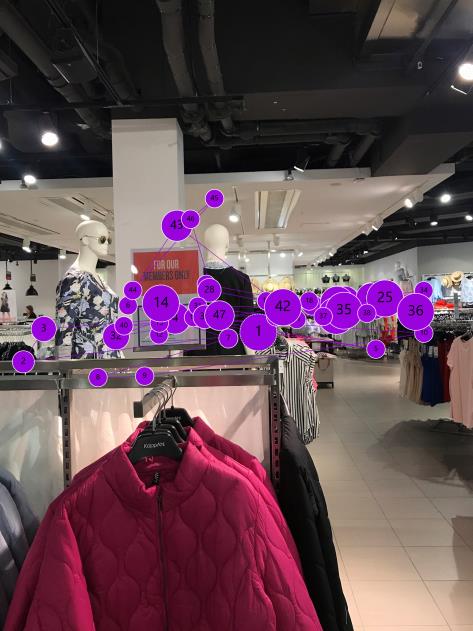
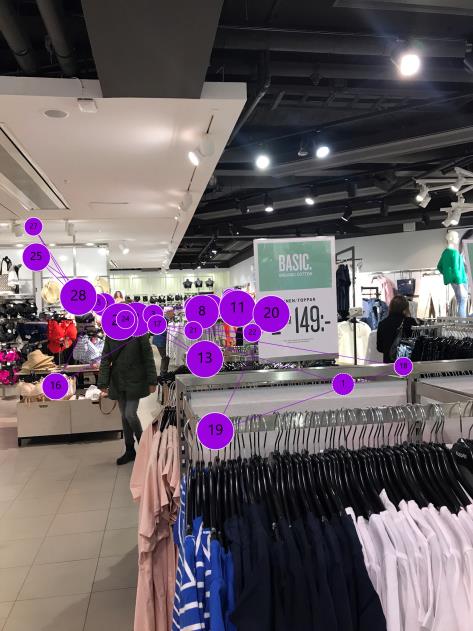
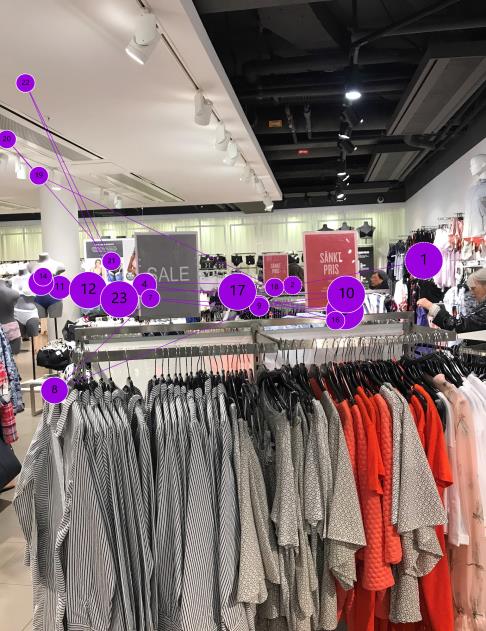
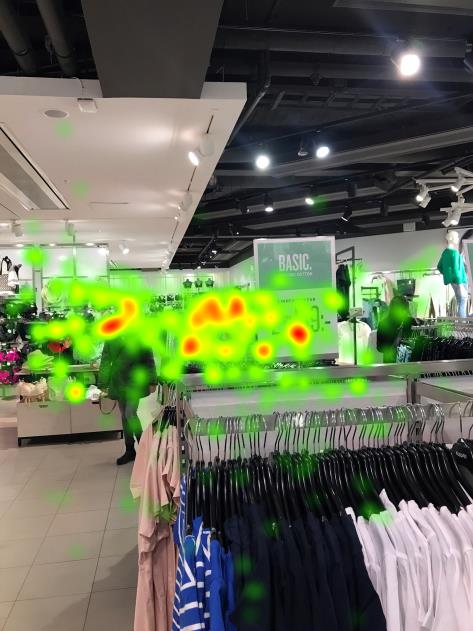
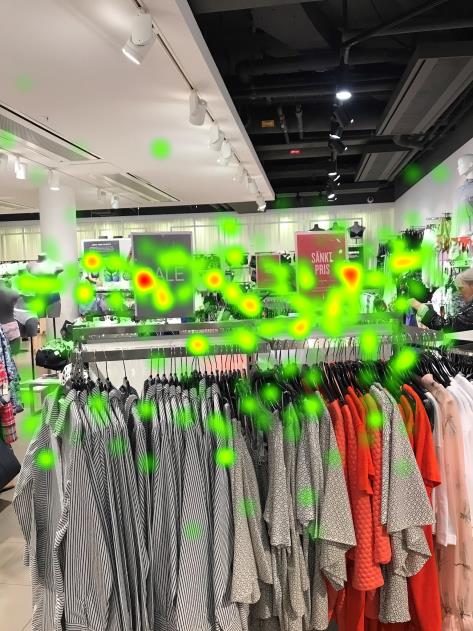
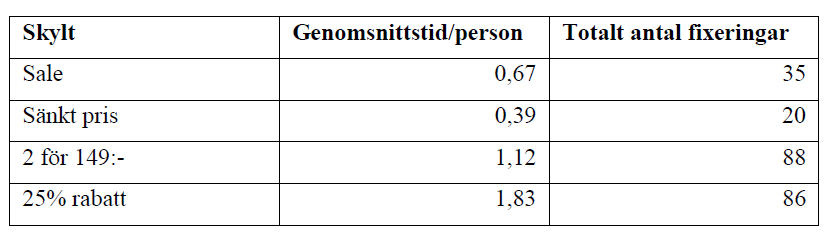
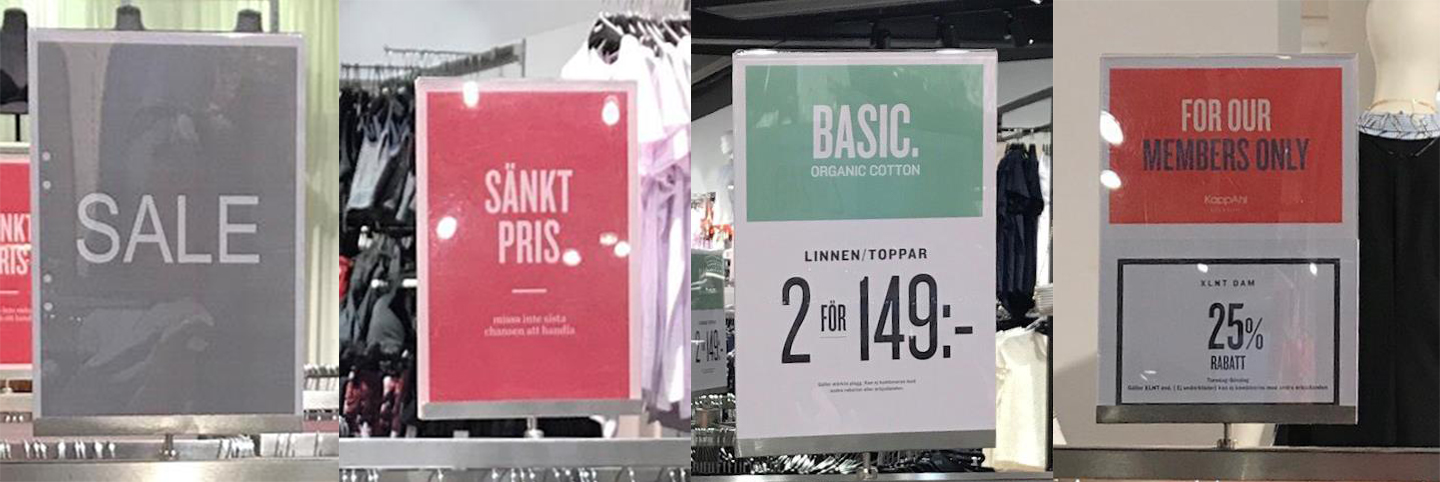
All test subjects’ questionnaires and film clips were anonymised by giving each test subject a letter, from AZ and then AA-CC when all the letters of the alphabet were used. When the mapping was completed and there was a match between the images and the movies, the program’s analysis tool could be used. A division of areas of interests, AOI, was made because the analysis of the signage will be based on four selected signs: SALE, Reduced price, 2 for SEK 149 and a 25% discount. Each sign corresponded to an area of interest, AOI, and this in order to be able to obtain numerical data on how long and how many fixations the test persons assigned to each sign.
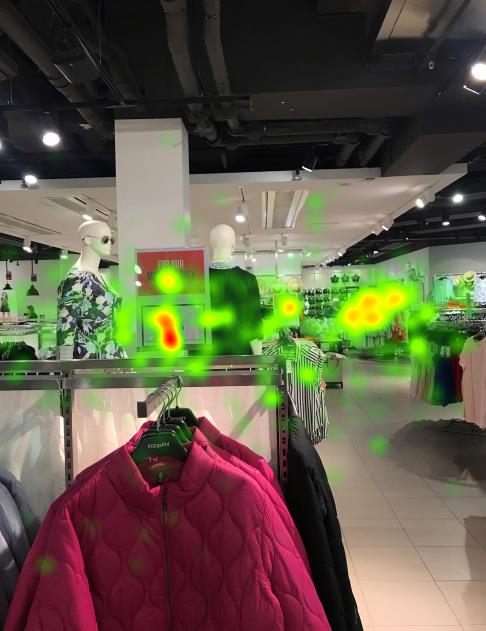
The analysis tools in Tobii Pro Lab were also used to create Heat Maps and Gaze Plots. The data from the surveys were then compiled in Excel so that the survey results could be compared with the data collected from the eye tracking glasses. This is to see how the test person responded in relation to how the person looked.
Results/Conclusion
The study has shown that in-store signage affects the customer’s attention when shopping on sale. The results from the study show that all but one test person noticed the experiment’s selected signs and that the different signs caught the test persons’ interest to different extents.
Both the choice of color and the message have an impact on how attractive a sign is perceived. However, the different variables, time, aesthetics and message were compared, and no correlations could be identified between them. The results from the survey will not be applicable to all stores as the experiment was conducted at KappAhl. The store environment may have affected the course of events of the test persons and thus also the results of the study. It is therefore of great importance to emphasize that the results of the study are not generalizable. Based on the results of the study, it can be stated that red color did not have as great an effect on consumer attention as expected. The majority of previous research indicates that the color red easily catches the customer’s attention and can also trigger them to make a purchase decision, which could not be confirmed in the study.
The experiment that made up the study compared whether there was a difference between the color choice gray and red, whereupon the results show that the gray sign caught the test subjects’ attention to a greater extent both in terms of time and number of fixations. The use of gray signs should therefore be effective, even though previous research and the survey data of the study indicate that red sale signs are most attractive. The result of the comparison between the four selected signs Sale, Reduced price, 2 for SEK 149 and 25% discount shows that different messages attract different amounts of attention and in this case the “25% discount” was most attractive. Stores with a similar price range and target group as KappAhl are therefore recommended to use sale signs with a percentage discount, as these have been given the most attention according to the eye tracking data.